Airborne Lidar
Light Detection and Ranging (Lidar) is a mapping technique which uses a laser to precisely measure the distance between the Lidar sensor and the object to be measured, or the ground in the case of airborne Lidar. The Lidar instrument transmits a laser pulse and reads the first and last reflection and the intensity of the returned signal. Multiple reflections occur when part of the laser pulse is reflected by vegetation or overhead wires and the remainder by the ground beneath. The distance from the sensor to the reflecting surface is calculated by recording the time taken for a laser pulse emitted by the sensor to be reflected back. Half of this journey time multiplied by the speed of light gives the distance travelled by the pulse. These data are calibrated using onboard and ground based Global Positioning System (GPS) instruments, and provide ground elevation information with an absolute precision of ±15cm. The Lidar instrument effectively scans the ground recording the surface topography at regular intervals (Fig.1). The ground interval is determined by the scanning speed and the speed and altitude of the aircraft.
Lidar data covering an area of 7.5km x 5.6km, extending from the River Derwent in the centre of the Vale of Pickering to the northern edge of the Yorkshire Wolds to the south of East Heslerton, was gathered in April 2005 using an Optech ALTM3033 LiDAR operated by the Cambridge University Unit for Landscape Management on behalf of the National Environment Research Council (NERC), Airborne Research & Survey Facility (ARSF). The Lidar data collected, in this case at a ground interval of slightly less than 1 point per metre square, allows us to create accurate 3D models of the land surface based on more than thirty million data points. The 3D model or Digital Elevation Model (DEM), when processed and visualised using a computer, can greatly enhance our understanding of the landscape and the environmental context of past activities. Lidar is a primary source of data for topographic modelling and mapping, providing context for archaeological activity across the landscape. In areas such as the Vale of Pickering, where drainage and the resulting desiccation of buried peat means that the land-surface is sinking Lidar survey, which is repeatable, provides the only realistic method of monitoring the rate at which the surface is changing.
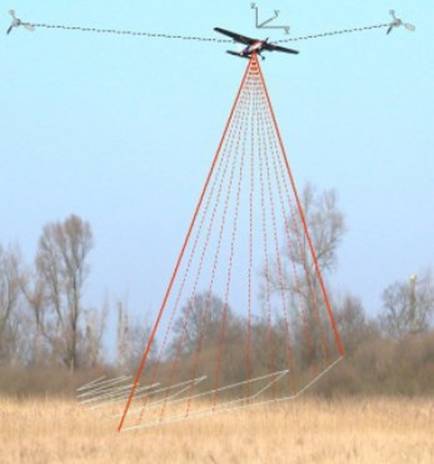
Figure 1: Lidar collection (Image Source Cambridge ULM website)
Why use Lidar data.
Lidar data can be used in a number of ways to examine different aspects of the landscape. It is collected rapidly and gives edge to edge coverage of large areas with high point densities providing data which can be used to precisely map surface topography.
Palaeochannels and Ancient Lakes.
Lidar is particularly useful for mapping slight undulations in valley plains and river terraces, the most common source of aggregates. Lidar data can be used to identify and map ancient river channels, palaeochannels, and lost lakes as well as low islands which may have been used in the past for settlement or burial. Lidar data can reveal subtle features that are not easily visible in the landscape; since the Lidar data is generated employing GPS positioning even features that are not clearly visible can be located and checked on the ground using a GPS.
The data can be used to model flood events and reveal relationships between settlement or cemetery distributions and ancient wetlands, and identify causeways used in the past to cross wetland areas. We believe that the Vale of Pickering was recognised as a sacred space from the early Prehistoric period onwards on account of the fact that the River Derwent, which rises just a few hundred metres from the sea, drains away from the sea directly inland for more than 80km before it flows into the Humber estuary.
In the Vale of Pickering where large areas, until recently, remained as wetlands often identified by the place-name element ‘ing’, the palaeochannels and relict lakes have the potential for the recovery of waterlogged deposits containing ancient plant remains and pollen. These organic materials can be used to establish a detailed picture of past environments over wide areas and reveal environmental change over time. The preserved plant remains can be dated using radiocarbon dating. The importance of this environmental evidence cannot be underestimated since this evidence does not survive in the dry areas on the sands and gravels where people mostly lived and worked. Recent work in the Vale of Pickering, in the Heslerton area, has revealed that whilst some of the palaeochannels do contain very good environmental evidence the impact of land drainage, global warming and enhanced drainage caused by reduction of the water table resulting from aggregate extraction, means that these deposits are unlikely to remain productive for more than a decade.
Excavation and other fieldwork over more than thirty years around the edge of Lake Flixton by Tim Schadla-Hall and his team, building on the work at Star Carr in the 1950’s, is revealing an astonishing picture of Late Palaeolithic and Early Mesolithic activity around what, at this time, was a remarkable stable lake. The stability of the water-level in Lake Flixton and its outflow into the Vale of Pickering indicates that further lakes, remnants of the former Lake Pickering, existed in the Vale. Clearly it is important to identify these relict lakes and test their potential for the survival of similar evidence. The Lidar data is uniquely suited for mapping relict lakes and modelling the water flow through the valley. The abundant archaeological evidence found on the calcareous sands and gravels on the southern side of the valley, where some areas are relatively well preserved, will increase pressure to look to the areas in the valley base for future sources of sand and gravel.
Ploughed out monuments
The single biggest contributor to the loss of archaeological evidence in Britain is plough damage, particularly since the introduction of mechanised farming. In some cases, such as areas of Rig and Furrow open fields, heavy cross ploughing has been deliberately applied to remove the pronounced ridges that characterise the old field systems; more often than not monuments have been gradually reduced by ploughing over the last 200 years. The regularly spaced surface points recorded with Lidar can be used to identify ancient earthworks and burial mounds or barrows which are now barely visible in the landscape. This has been very effectively demonstrated by English Heritage in the Stonehenge landscape (Bewley et al 2005) In the Heslerton landscape large areas of archaeological land-surfaces and, in some cases, whole monuments over a metre high, have been buried beneath gradually accumulating blown sands. In these areas the Lidar fails to identify the buried features but reveals the extent of hedge-banks which have been greatly increased in height by blown sands trapped in the hedges; this can be used to map quite precisely those areas where blown sands have contributed to the protection of the archaeology. On the top of the Yorkshire Wolds, large barrows dominated the Late Neolithic and Bronze Age landscapes. These mounds were mostly made of chalk and earth and even after intensive ploughing the much reduced and spread mounds can be clearly seen in the Lidar data. To accurately map and identify smaller features higher densities of Lidar data with point counts of five to ten points per square metre is required although, even at the available resolution, the broadly spread banks of ploughed out liner earthworks are visible when the surface is carefully modelled and shaded.
The wood for the trees
Airborne Lidar survey undertaken in winter when there are few leaves on the trees can be used to map the ground surface even in forested areas (Devereux et al 2005). Although many points are reflected by the canopy and branches of the trees some points get through the tree canopy and can be used to reconstruct the surface beneath the trees. It follows that for precise mapping of sub canopy areas high density surveys produce the best results. Spectacular results have been secured using Lidar data collected at 8-11 points per metre over forest in Austria, revealing barrow cemeteries and field systems that would be almost impossible to map using any alternative technique; especially since even high density multi-pass surveys can cover several square kilometres per hour (Doneus and Briese 2006).
Lidar Data and Data Processing
Lidar surveys generate large volumes of data - in the Heslerton survey, more than 60 million points comprising the x, y and z coordinates and intensity of the reflected pulse for the first and last pulse. For our purposes the first pulse data is not needed; had the survey been undertaken at high density during a crop-mark phase it is theoretically possible that the Lidar could be used to examine variation in crop height. Processing, analysis and visualisation of such a large data-set requires powerful computing facilities and dedicated software. The data collected as part of the NERC ARSF programme is processed at Cambridge, generating a precisely georeferenced data set provided as an ASCII text file comprising the last and first pulse data for each flight path across the research area. Prior to secondary processing and analysis each file was split into two files comprising the first and last pulse data-sets and then the files from each data set combined to produce a single last pulse file covering the research area. The last pulse Lidar data, at full resolution, shows the roughness of the fields, arising from reflections from tufts of vegetation, clumps of earth, trees, bushes, overhead wires and buildings, which can hinder feature definition. The intensity data when viewed in greyscale looks not unlike a monochrome air-photograph and clearly shows the vegetation cover; the reflected intensity has also been shown to demonstrate areas of wetter soils which are important in isolating palaeochannels.
First stage visualisation and analysis of the data was undertaken using an OpenGL toolkit from ScienceGL, Inc.) and a powerful OpenGL graphics card within G-Sys, the LRC GIS. This 3D viewer provides an environment which enables the entire data-set to be loaded and provides functions to manage the palette, lighting levels and direction, surface filtering and real-time rotation of the 3D model. Initially no attempt was made to generate a flat-earth model by filtering out buildings and trees as very limited areas were obscured by tree cover.
After initial assessment an attempt to generate a flat-earth model, by classifying and removing buildings and trees using TerraScan with Microstation, produced a poor result and alternative software was sought. Following searches on the web and trials with a number of different programs Cloud Peak Software, LASEdit, was selected on the basis that it was easy to use and generated an appropriate result. Part of the problem with our first attempt to generate a flat-earth model was that the data processing removed too much surface information, not helped by the fact that the survey covers both a very flat wetland area and a part of the Wolds with high relief contrasts and steep sided valleys. In creating a flat-earth model it was important that not too much data was eliminated; the classification of scattered and other above surface points relies upon the calculation of the slope between each point and the underlying surface and the relative elevation of objects such as buildings both to the adjacent points and the underlying surface. An important aspect of the Heslerton data was the need to see the raised hedge-banks and at the same time remove most of the scatter caused by trees.
Figures 2 to 8 show various aspects of the Lidar data for part of the survey area. Each image, extracted during processing with LASEdit software, shows the same area. Figure 2 shows the almost photographic nature of the intensity data, whilst Figure 3 shows the unedited raw point cloud data coloured according to elevation. After processing with LASEdit the high structures and much of the vegetation are isolated, with points showing in green in Figures 4 and 5. Whilst most of the high buildings and clutter associated with trees and other vegetation have been removed (see figures 5-7), some clutter still remains and whilst this could be removed by further editing it is unnecessary. The point spacing in the scan-lines can be seen in Figure 7; the spacing along the scan-lines varies according scan angle but averaged between 1.25m and 1.5m; between scan-lines the distance averaged about 2m. Given the relatively low density of the points it is a little surprising that we have been able to resolve so many under canopy features. The brick-pits which feature in Figures 2 to 9 are clearly visible in the filtered Lidar, the effectiveness of which is demonstrated when one compares the vertical photography in Figure 9 with the flat-earth model shown in Figures 6 to 8.
Figure 2: Lidar last pulse intensity image showing overhead wires, vegetation buildings and the rough field surfaces.
Figure 3: Lidar last pulse point data coloured according to elevation.
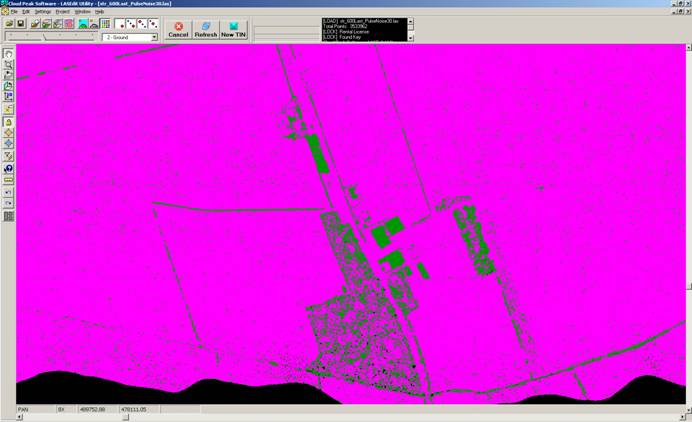
Figure 4: Lidar Last Pulse point data showing classification, points in green include vegetation and buildings which are removed to generate a flat-earth model.
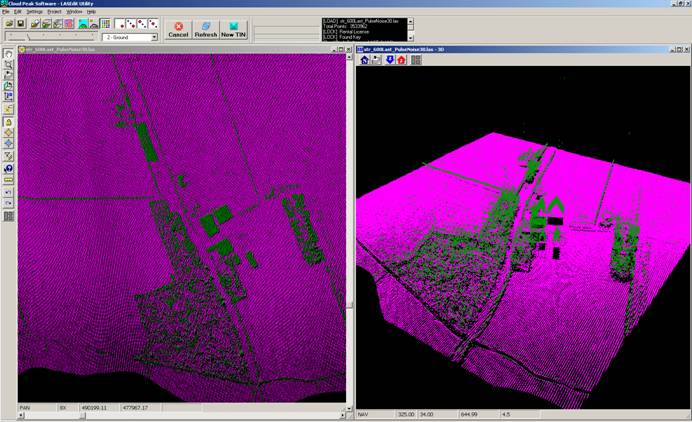
Figure 5: Lidar last pulse classified data showing the point cloud in plan and 3D, the roofs of buildings can be clearly seen in the 3D view.
Figure 6: Lidar last pulse flat-earth model in which most of the major high objects have been eliminated.
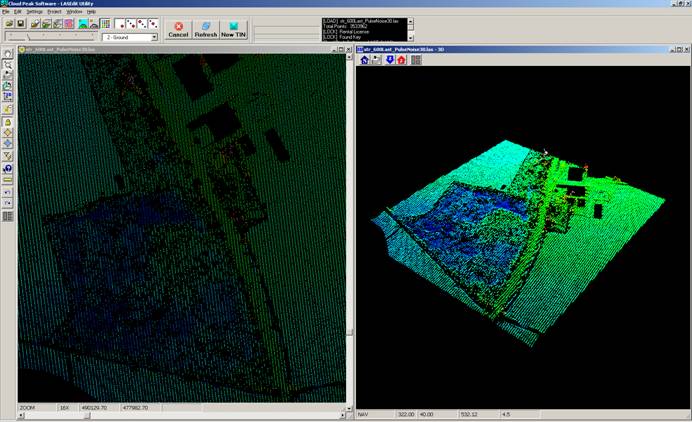
Figure 7: Lidar Last pulse data after filtering to produce flat-earth model, the spacing of the Lidar points can be seen clearly in the left hand window.
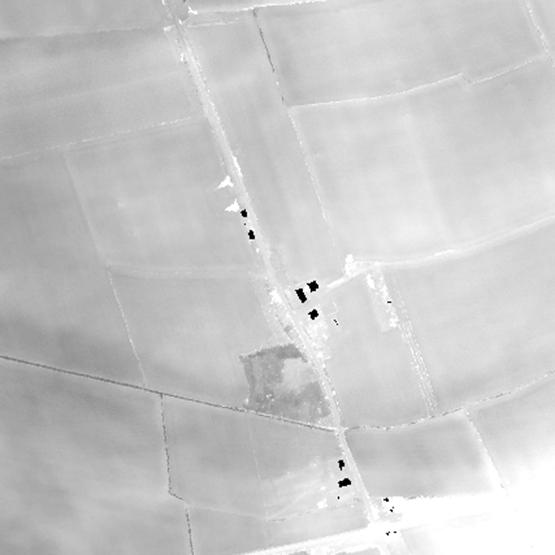
Figure 8: Lidar last pulse flat-earth greyscale image showing location of post-medieval brick-pits hidden beneath woodland.
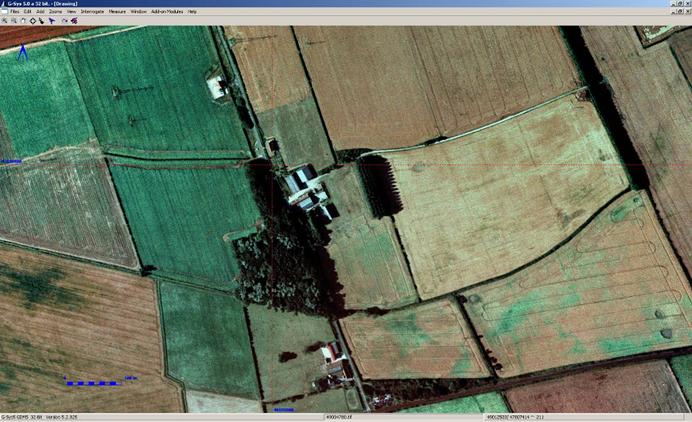
Figure 9: Getmapping imagery showing the dense vegetation obscuring the brick-pits.
Secondary processing of the Lidar data was undertaken in G–Sys, with an OpenGL control produced by ScienceGL, using the flat-earth model generated using LASEdit at a ground resolution of 2.1m. The OpenGL toolkit provides functions for real-time rotation, lighting, shading, horizontal slicing (for flood modelling) and overlay of vector plots of air-photographic and geophysical evidence. In order to maximise the returns from the secondary analysis the area was split into two parts, the flat vale and the Wolds and southern edge. Using varying lighting angles, palettes and light levels the data was first examined to see whether it could be used to identify ploughed out earthen monuments. The wooded areas were examined to reveal sub-canopy features and the lower valley was then examined to identify palaeochannels and lakes. With the known archaeology overlain on the Lidar model the relationship between the known archaeology and topography was examined and flood modelling was performed to attempt to identify the relationship between the ancient wetlands and the known archaeology.
Ploughed out monuments and other features.
The Lidar data for Heslerton has allowed us to identify a number of ploughed out barrows on the Wolds, show the elevated mounds which provided the setting for two medieval post-mills in West Heslerton and identify a number of new features (Figures 10-12)
Figure 10: Lidar flat-earth model showing the two mounds marked with pins where post-mill sites have been identified in geophysical survey.
Using the flat-earth shaded model we can highlight subtle variations in the land form as in Figure 10 - two slight mounds on the eastern bank of a small valley which were used to site medieval post-mills (Figure 10). One of the mill sites was observed from the air, and was even visible as a crop-mark on the ground when the field was planted with lucerne during the 1980’s. The second was discovered through geophysical survey; it is likely that both occupy the site of extant round barrows (Figure 11).
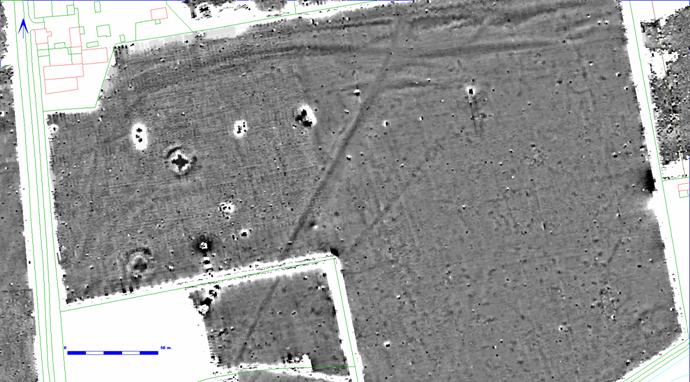
Figure 11: Geophysical survey showing the tell-tale cross trenches from two medieval post-mills.
On the hard geology of the Wolds earthen monuments incorporated a lot of stone and even after long term ploughing subtle traces of both burial mounds or barrows and linear earthworks survive, visible in the Lidar data even if difficult to see on the ground. The effectiveness of Lidar in identifying ploughed out features has been demonstrated in the Stonehenge landscape by Bewley et al. where both known and new monuments were identified using Environment Agency Lidar (Bewley et al 2005). The objectives in the Heslerton survey were focussed upon the Vale rather than the Wolds, only a small area of the upland was covered; however both barrows and other monuments show well when carefully lit and shaded (Bewley et al. 2005).
Figures 12 to 16 show the southern side of the survey area, covering the Wolds scarp and the northern edge of the Wolds viewed from the north with lighting applied vertically from above in Figure 12, the south-east in Figure 13, the south-west in Figure 14, the north-west in Figure 15, and the north-east in Figure 16. Red pins or markers have been used to show the locations of a number of round barrows, the east Heslerton Long Barrow, and a segment of ploughed out earthwork where an ancient field boundary has been removed. A number of marl-pits are clearly visible showing the reverse light/shadow signature to that of the ploughed out barrows. This group of images shows the effect of moving the ‘virtual sun’ to apply light and shade effects across the data. It is important that this should be possible in real time if the full benefits of the data are to be realised.
Figure 12: Lidar view of part of the northern edge of the Yorkshire Wolds lit from above – markers show the location of ploughed out monuments.
Figure 13: Lidar view of part of the northern edge of the Yorkshire Wolds lit from the south-east – markers show the location of ploughed out monuments.
Figure 14: Lidar view of part of the northern edge of the Yorkshire Wolds lit from the south-west – markers show the location of ploughed out monuments
Figure 15: Lidar view of part of the northern edge of the Yorkshire Wolds lit from the south-east – markers show the location of ploughed out monuments

Figure 16: Lidar view of part of the northern edge of the Yorkshire Wolds lit from the north-east – markers show the location of ploughed out monuments
In the light of the work at Stonehenge it was anticipated that earthworks and other ploughed out monuments on the Wolds would show well. The areas of blown sands where the known archaeological activity is at its densest were examined carefully and the Lidar evidence confirms that with the exception of broad and shallow filled dry valleys the blown sands mask the ancient topography in this area. Even the rig and furrow, visible over large areas in the geophysical survey, does not show in this area. The distribution of the blown sand can be isolated with precision as the hedge banks running across the blown sands are enhanced in height and show as slight ridges extending from the foot of the Wolds towards the edge of the wetland areas (Figure 17).

Figure 17: Lidar flat-earth model showing enhanced hedge banks extending from the area coloured in red/orange into the green areas.
The geological and fluvial history of the Vale of Pickering is complex with the original river basin draining into the sea near Filey underlying the drainage basin of Lake Pickering and the River Derwent which drains inland. The current topography preserves aspects of the earlier drainage system. After careful examination of those areas where known monuments existed, with the exception of the Old Abbey, in Yedingham, which is covered by environment agency and not covered in the NERC survey, it was clear that even the barrow cemetery in a field called ‘Roundhills’ could not be isolated in the Lidar data beyond the fact that it occupied an island or ridge. Two other features did however show very clearly - a large circular feature measuring about 180m in diameter surrounded by a shallow depression and situated on the edge of one of the palaeolakes. If this is indeed a monument it is likely to be a large henge incorporating a wet ditch which is likely to hold important environmental evidence. Geophysical examination using a gradiometer failed to confirm the presence of the suggested ditch; however, in this zone in the wetland the gradiometer response is very poor and only intervention on the ground can confirm or disprove this interpretation (Figures 18,19).

Figure 18: Lidar valley floor showing palaeochannels and gravel islands the possible henge is identified by the arrow

Figure 19: Lidar, possible henge in the centre of the Vale of Pickering next to a palaeolake.
Towards the eastern end of the survey, to the north of the village of Sherburn, a causeway extending for a kilometre north across the valley to the north of the church is reminiscent of the causeways found at Fiskerton and elsewhere in the Witham valley (Figure 20). Sherburn church, which incorporates Anglo-Saxon fabric, is itself situated on a spur which juts out into the valley and it is likely that this causeway reflects a far earlier route across the valley and may connect with timber causeways like that found crossing the Costa Beck between Kirkby Misperton and Pickering, further to the west.

Figure 20: The valley floor of the Vale of Pickering between Heslerton and Sherburn showing the causeway extending towards the middle of the valley north of Sherburn.
Features under tree canopy
In addition to the identification of the post-medieval brick-pits, discussed above, the Lidar data has, despite the limited density of the points, revealed very clearly the context of the Late Bronze Age/Early Iron Age palisaded enclosure of Staple Howe. The top of Staple Howe itself has remained mostly clear of trees since it was excavated by Brewster in the 1950’s (Brewster 1963). It sits within an area of planted forestry which obscures the landform of the Howe itself and the surrounding terrain. The difficulty of seeing the context today is clearly demonstrated in Figure 21 which shows Staple Howe wood as it is today in Getmapping air-photography. Despite the density of the canopy when the trees are in leaf the Lidar data collected in April gives a reasonable idea of the topography surrounding the Howe but the picture remains cluttered with the reflections from trees and undergrowth (Figure 22). Figure 23, in contrast, shows the site after classification and extraction of the flat-earth model. Not only does the flat-earth model show the Howe in context but also reveals a number of quarry pits in the woods around it.

Figure 21: Staple Howe wood seen in Getmapping air-photographic imagery.
Figure 22: Lidar, Staple Howe wood (seen from the north), with the Howe marked, as seen in the unedited last-pulse data
Figure 23: Lidar, Staple Howe wood (seen from the north), with the Howe marked, as seen in the flat-earth model.
When compared with the second Late Bronze Age/Early Iron Age palisaded enclosure excavated by Brewster in West Heslerton the similarity in the topographic position becomes very clear (Brewster 1981). In both cases the enclosures occupied steep sided chalk knolls which, despite being situated part the way up the scarp slope of the Wolds, were cut off from the Wolds by a steep valley which ran between the Wolds and the knoll (Figure 24).
Figure 24: Lidar, the locations of Staple Howe and Devils Hill.
In the Heslerton landscape tree cover is very limited, particularly on the sands and gravels that are the focus of this research. What is clear is that, with higher density data Lidar can provide a magnificent tool for investigating landscapes beneath tree cover.
Features on the alkaline sands and gravels
The blown sands that have buried much of the archaeological resource on the alkaline sands and gravels between the 28m and 40m contours on the southern side of the Vale of Pickering have also masked ancient topographic detail. Old field boundaries can be reconstructed from ridges - the ploughed out remnants of hedge banks - which can easily be highlighted using shaded surfaces. The extent of the blown sands can easily be mapped using the Lidar data to reveal the enhanced height of the hedge banks where they have risen as blown sands have built up within them. The rig and furrow field systems, which have been identified through geophysical survey on the alkaline sands and gravels, have been so effectively flattened by more than 200 years of ploughing and further aeolian sand movement that they cannot be seen in the Lidar data at the available resolution; higher resolutions may reveal detail that cannot be seen in the current data-set.
Even in the area blanketed by blown sands a number of features can be detected which add insight into features identified during the original rescue excavations at Cook’s Quarry, West Heslerton in the 1970’s and 1980’s and through geophysical survey. The windmill sites discussed above provide two examples ( Figures 10 and 11); a potentially more significant discovery relates to a prehistoric trackway, first encountered during excavations at Cook’s Quarry. The trackway was identified on the edge of the quarry during 1978; more than 150m had been removed by quarrying prior to the rescue excavations. Only a short section of the trackway was excavated, on the edge of the quarry, where the evidence pointed towards a Late Bronze Age/Early Iron Age date. The trackway was characterised by a dense sequence of wheel-ruts, cut into and filled by blown sands, and flanked by minor ditches to the north and south (Powlesland et al. 1986 Figure 52). The trackway, which had formed a hollow way, was truncated prior to excavation and the date derived from an assemblage in the fill of the flanking ditch. Examination of the geophysical survey and air-photographic survey to the west of Cook’s quarry reveals a trackway or possible pit-alignment cursus some 40 metres wide and extending for more than two kilometres to the west. A further 40 metres to the south a complex ribbon of inter-cutting ditches appears to reflect an extension of the excavated trackway. The line of this narrower trackway has survived in a number of field boundaries; for about 500 metres this feature is visible as a series of linear features in the Lidar data, where it also clearly pre-dates the rig and furrow. Given the nature of the blown sands and the degree to which the topography has been smoothed by the deposition of the sands this topographic survival is remarkable and indicates that this trackway must have survived in use into the medieval period at least.
Figure 25: Lidar, course of prehistoric and later trackway defined by surviving earthworks, identified by red arrows, the green arrow shows a possible ploughed out barrow or structure surviving as a slightly elevated feature.
The drainage history of the Vale of Pickering is complicated due to the blocking of the original outflow from the valley into the sea during the last glaciation and the subsequent formation of Lake Pickering with its outflow inland rather than on the coast. The Lidar data, particularly when viewed as a flat-earth model, gives detailed evidence showing the various dry-valleys and gullies which emerge on the scarp slope of the Wolds and extend across the alkaline sands and gravels towards the centre of the Vale. These valleys incorporate active streams in some places and have been subjected to flash flood and serious erosion events. The outwash from flood events, as recently as the last century, has covered extensive areas and buried archaeological evidence, reducing the returns from remote sensing. In these areas we might expect enhanced stratigraphic preservation but be faced with difficulty in assessing the resource. The Lidar mapping provides an important resource for the identification of the broad and shallow relict valleys where they cross the sands and gravels, enhancing our ability to interpret the results of remote sensing methods.
Features in the lower valley
In environments like the broad flat valley floor of the Vale of Pickering, Lidar survey provides the most powerful method for mapping the palaeochannels, palaeolakes, gravel islands and spurs which, in the past, formed a focus for settlement and burial complexes. Although desiccation and loss of the peats in the lower valley has led to sinking of the land surface the local topography has not been buried and masked by blown sands as it has on the southern margin of the valley. The ScienceGL software toolkit used for the visualisation of the Lidar data provides functions that allow the data to be constrained between specific elevations, so that colour-mapping can more effectively be used to isolate topographic features, and permit primitive flood modelling using a transparent horizontal overlay. Although this method of modelling flooding is inaccurate and does not take account of many critical variables it can be used to model flood limits, reveal shallow islands and critically show the relationship between these and archaeological features.
The possible henge, identified in figures 18 and 19 above, is located on the edge of and tilted towards a palaeolake, initially identified through an environmental sampling exercise. The Lidar data provides topographic evidence that can be used to reconstruct the potential extent of flooding at different periods and develop an understanding of the dynamics between the wetland and its use in antiquity. A second possible henge, of similar size c.160m in diameter and located beyond the bounds of the Lidar data-set, has been identified in a 1971 vertical photograph held by the NMR, just to the north of the same paleolake.
Figure 26: Lidar, palaeolakes, perhaps the surviving remnants of Lake Pickering.
Mapped to emphasise a flood limit at 21.64m (Figure 26) it becomes clear that the main palaeochannel of the River Derwent is slightly constrained in the research area but links two palaeolakes; the full extent of the palaeolakes cannot be defined as they extend beyond the boundary of the dataset. When the flood boundary is increased to 22.5m gravel spurs and islands on the valley floor start to be defined; moreover, when archaeological features identified through other forms of remote sensing are plotted over the Lidar data there is a clear correlation between the slightly elevated islands and archaeological activity (Figure 27). These islands have an elevated importance given their relationship to the wetland areas and the potential for the recovery of palaeoenvironmental evidence. These islands, set in an ancient marsh, are also likely settings for ritual sites associated with water linked religions. Adjacent to the River Derwent in Yedingham a small aggregates quarry is actively quarrying one such island; the quarry operations are covered by a simple watching brief planning condition since, at the time that the application was passed, there was insufficient evidence to for archaeological activity to place a more detailed condition on the planning consent. It is likely that the overwhelming level of archaeological activity on the alkaline sands and gravels that follow the edge of the wetland will encourage future mineral operators to investigate alternative sources, like that now being worked in Yedingham. It is thus important to be able to map those areas where archaeology may be expected.
Bringing together the remote sensing and other evidence from research in Heslerton it is clear that hydrological mapping must be undertaken with caution; the shrinkage of peats in the centre of the valley has not been uniform and we have insufficient dated environmental evidence to attempt to model the changing water-table levels over time nor to model how much shrinkage has occurred in different areas. Although there is a very precise correlation between the line of a Late Roman drainage dyke, a possible flood defence, and the 28 metre contour a considerable amount of work is required if we are to model the ancient land-form lower in the valley where it is likely that settlement of the surface may have reduced elevations by two to three metres. Subtle changes in the degree of shrinkage in the centre of the valley relative to the areas towards edge of the main floodplain have changed the overall slope such that areas that we believe to have been effectively islands in the marsh have limits which can easily be defined on the side facing the river but less so on the south side where even a 20cm difference in surface shrinkage makes it difficult to isolate the full extent of the ‘islands’ (see Figure 27).
Figure 27: Lidar, flood model with the water level constrained to 22.5m showing both a multi-period cemetery and settlement site of unknown date on slight islands to the south of the River Derwent.
Intensity Data
Although standard Lidar does not record the level of information gathered by more modern full waveform instruments however, in addition to a 3D point identifying the point of reflection on the ground the intensity of the returned reflection is recorded. The data returned by full waveform instruments can be used, for instance, for the classification of tree species in forest due to the different scattering characteristics of the tree canopy. When the intensity is mapped as a grey scale image the overall result looks not unlike a conventional monochrome air photograph; bright pixels indicate that a high percentage of the original signal was returned whilst dark pixels indicate that the returned signal was diffused and thus less returned signal was read by the sensor. In certain environments it is becoming clear that the intensity of the returned data can be used to differentiate soils perhaps on account of varying soil moisture or, in peaty environments, varying quantities of organic inclusions causing increased dispersion of the returned laser signal.
Figure 28 shows an area of the Lidar intensity data immediately to the north of Cook’s Quarry in West Heslerton. One archaeological feature, a broad ditch thought to be part of the late Roman flood defences, shows very clearly running from east to west in a field to the north-west of the quarry. This was clearly visible as a soil mark photographed from the air and verified by a visit on the ground. To the north of the quarry where the alkaline sands and gravels give way to acidic sands and gravels with peat deposits, periglacial features, visible as soil marks, also show on account of a reduced reflection.
Figure 28: Lidar, intensity data revealing both periglacial and archaeological features near Cook’s Quarry, West Heslerton.
Careful examination of the intensity image confirms that the intensity returns are affected by relative wetness in the soil; however within the Heslerton data-set the majority of returns which can be isolated as potentially wetter areas also feature as soil marks in air photography and it is not entirely clear whether the differential wetness is not simply a consequence of the presence of different soils. If, as it appears, the intensity data is showing a combination of variations in soils and wetness then it offers important potential for enhancing the conventional soil-mark and even crop-mark records. The Heslerton data was gathered in April, when crops and vegetation canopy were at a minimum, for the purpose of recovering the best topographic evidence, and thus it is not suited for tests to see if crop-marks are visible in the intensity data. Figures 29 and 30 show an area of Rig and Furrow in Yedingham as a soil-mark recorded in the Lidar in April, and in vertical air photography taken in June.

Figure 29: Lidar, intensity data showing ploughed out rig and furrow

Figure 30: Vertical air photography (source NERC ARSF) showing the same rig and furrow as seen in figure 29, showing as a soil-mark in June of the same year.
Integrating Lidar with other data-sets
The size of Lidar data-sets, incorporating millions of 3D points, offer particular challenges with regard to data processing and integration with other data sources. Visualisation incorporating real-time rotation and control of lighting strength and direction is necessary if slight features are to be isolated. Software tools such as the shareware programme OpenEV with FWTools provide facilities for draping air-photographic or multi-spectral imagery over the Lidar surface model and can be used to generate movie files showing fly-overs for the combined data-sets.
The correlation between features identified through aerial or geophysical survey and the micro-topography of broad valley plains can be readily demonstrated by overlaying digitised vector plots on the Lidar surface model (Figures 31,32,33). For day to day use within a GIS a colour model derived from the Lidar data can be generated at an appropriate resolution and used as a topographic underlay to other layers of GIS data. The Heslerton NERC data-set incorporates more than 30 million points of last-pulse data, the raw data file is just under 1Gb in size. The processed data with a ground resolution of one metre per pixel comprises an 83Mb file, with 16 bit precision (required in order to support interactive readout of absolute heights) or 41Mb as an 8 bit colour model (providing good data visualisation but with the loss of the interactive numeric precision of the 16bit data).

Figure 31: Lidar, air-photographic and geophysical plots showing the location of settlement, cemetery and other archaeological features located on slight gravel islands near the River Derwent in the centre of the Vale of Pickering.
Conclusions
Lidar data, even collected at relatively low resolutions, is an immensely important resource for mapping topography at the landscape level. Although the absolute accuracy of Lidar data (±15cm) is less than could be gained using a high precision GPS (±.5cm), the relative accuracy is within a few centimetres. The Heslerton survey covering 7.5km x 5.7km was undertaken in less than two hours; to cover the same area even with a vehicle mounted GPS would take weeks and would still not give total landscape cover. In areas of subtle earthworks GPS survey gives better results than Lidar collected at 1.5-2m resolution, largely because the surveyor on the ground can make sure that changes of slope can be precisely targeted; higher resolution Lidar at .25m resolution would of course give sufficient density of points to map most earthwork complexes. Higher density Lidar surveys can accurately map slight features under tree canopy when the data is gathered in the winter. Lidar data is gathered within a GPS based mapping environment; this is important since any point within the data set can be visited or located on the ground using high precision GPS survey equipment. It is critical to realise that non GPS based data such as the GetMapping data, based on the established Ordnance Survey projection and used as a base-map by the LRC, is far less precise with errors in the eastings and northings of up to 6 metres. The Ordnance Survey is re-projecting the map base for the whole country at present so new and future maps will more closely match the GPS linked Lidar data.

Figure 32: Geophysical survey and air-photographic plots showing a linear settlement complex following the edge of the wetlands flood-modelled to the 28m contour and edge of the alkaline sands and gravels
Lidar likewise is effectively the only method that will allow us to rapidly map palaeochannels, palaeolakes and low elevation islands in areas like the Vale of Pickering. When combined with soils evidence, air-photographic, geophysical, other remote sensing data and predictive modelling of ancient water levels, areas of archaeological and palaeoenvironmental sensitivity can be precisely identified. The distribution of aggregates in the southern side of the Vale of Pickering is closely matched by the distribution of archaeological evidence relating to settlement and burial from the Neolithic period onwards. The alkaline sands and gravels situated between the 28 and 44m contours show the highest density of archaeological activity identified in any landscape area of similar scale in Britain (Figure 33). The density of the identified archaeological evidence on the alkaline sands and gravels is so high that aggregate extraction within this zone should be discouraged; the combined remote sensing and other evidence for the lower valley indicates that, with the exception of some of the gravel islands, alternative sources of aggregates may be sought here.

Figure 33: Lidar, air-photographic and geophysical plots showing the location of settlement, cemetery and other archaeological features located on a sample area of the alkaline sands and gravels on the southern side of the Vale of Pickering.
The acidic sands and gravels in the lower valley include post-glacial islands, some of which show relatively intense use of these well drained and slightly elevated areas (Figure 31). The palaeolakes and palaeochannels, important on account of their potential for the recovery of dated environmental evidence and for their role in the Palaeolithic and Mesolithic landscape in particular, are threatened with desiccation arising from draw-down related to quarries like that in Yedingham, within 200m of the River Derwent, combined with the effects of global warming and continued drainage of the lower valley. Had the Lidar data and other evidence been secured prior to the planning application for this recently re-established quarry then a sampling programme in the adjacent palaeochannel could have been requested as part of the planning process; now that the palaeochannels have been mapped there is good justification for undertaking a sampling programme to test for the effects of draw down and secure much needed palaeoenvironmental evidence which should survive in the palaeochannel.
The ability to use the Lidar data to identify potential sources of environmental evidence will enable environmental sampling schemes to be incorporated early in the planning process in a way not possible without the precise topographic data derived from the Lidar data.
The limited extent of the Lidar coverage, within the NERC ARSF data-set, to the north of the River Derwent indicates that the northern side of the valley has a different geomorphology that that to the south and that we should anticipate a different settlement and activity pattern in the lower valley owing to the presence of more substantial islands in this area.
Analysis and visualisation of the Lidar data from Heslerton confirms that this data source offers the potential to radically improve the returns of desktop assessment of potentials on river terraces and valley floors, providing baseline information that cannot be economically secured using other methods. Besides enabling low-lying features to be identified where they have been ploughed out, allowing features to be identified beneath tree cover and palaeochannels and lakes to be identified, the Lidar enables the context of crop-mark features to be examined allowing targeted geophysical survey in areas which are likely to have been utilised but for which there is no air-photographic record.
There are clearly considerable additional benefits to be gained from securing Lidar data sets with higher point densities; not only would this improve documenting areas beneath tree cover but it would also improve the accuracy of modelling slight features or narrow earthworks. The Lidar intensity data likewise, when recorded at high densities, provides a method for accurately recording soil-marks, areas of enhanced soil wetness and seems likely also to offer the potential for recording conventional crop marks on account of differences in the reflective characteristics of the vegetation.
Bibliography
Bewley, R. H., S. P. Crutchley, and C. A. Shell. 2005. New light on an ancient landscape: lidar survey in the Stonehenge World Heritage Site. Antiquity 79:636-647.
Brewster, T. C. M. 1963 The Excavation of Staple Howe, E. Riding Arch. Res. Committee
Brewster, T. C. M. 1981 ‘The Devil's Hill’, Current Archaeol., 76 (1981), 140-41
Devereux, B. J., G. S. Amable, P. Crow, and A. D. Cliff. 2005. The potential of airborne lidar for detection of archaeological features under woodland canopies. Antiquity 79:648-660
DONEUS, M. and BRIESE, C., 2006. Digital terrain modelling for archaeological interpretation within forested areas using full-waveform laserscanning. In: M. Ioannides, D. Arnold, F. Niccolucci and K. Mania (Editors), The 7th International Symposium on Virtual Reality, Archaeology and Cultural Heritage VAST (2006), pp.155-162
Data Source and Funding
The Lidar data discussed above was secured through a NERC Airborne Research Facility (ARSF) award and collected by the Cambridge University Unit for Landscape Modelling. The Lidar data set was combined with airborne remote sensing evidence gathered under two NERC ARSF awards, the first in 1992, the second in 2005.
The analysis and processing of the Lidar data and its integration with a full range of other remote sensing data was made possible thanks to grant funding from English Heritage as part of the Aggregates Levy Sustainability Fund (ALSF Project 3841). Further information regarding the processing and analysis of the other datasets can be found elsewhere on this website.
We are grateful to NERC and English Heritage for their continued support, which is allowing us to develop an unprecedented picture of an archaeological landscape and identify and develop more archaeologically sustainable approaches to the extraction of aggregates in the future.
WEB Links to other sites discussing Lidar in Archaeology
English Heritage Lidar Pages
http://www.english-heritage.org.uk/server/show/nav.00100200300400a001
Cambridge University Department of Archaeology: Loughcrew Project
http://www.arch.cam.ac.uk/~cfa1001/loughcrew/lidar.htm
Birmingham University Department of Archaeology:
http://www.arch-ant.bham.ac.uk/bufau/services/3Dscan/Lidar.htm
Birmingham University Department of Archaeology:
Lidar Intensity Assessment
http://www.methodsnetwork.ac.uk/resources/casestudy4.html
Software
Primary processing and classification of the NERC ARSF data for West Heslerton was undertaken using Cloud Peak Software’s LasEdit Package.
http://www.cloudpeaksoftware.com/
Visualisation of the processed data overlay of other data sets and GIS integration was undertaken using G-Sys employing a ScienceGL OpenGL toolkit.